
[iOS] Charts 라이브러리를 사용하여 Upbit 시세 그래프 그리기
Charts
- Android MPCharts와 유사
- Line, Pie, Bar 등등 여러 종류의 차트를 만들 수 있음
- 설치 방법은 아래 github 링크를 참고
GitHub - ChartsOrg/Charts: Beautiful charts for iOS/tvOS/OSX! The Apple side of the crossplatform MPAndroidChart.
Beautiful charts for iOS/tvOS/OSX! The Apple side of the crossplatform MPAndroidChart. - ChartsOrg/Charts
github.com
Model
- 샘플 데이터는 Upbit API(마켓 정보 조회 / 캔들 조회)를 사용하였다.
- 종목 조회 / 종목 시세 조회 Model 만들기
// 종목 조회
struct MarketModel: Decodable{
    let market: String
    let korean_name: String
    let english_name: String
}
// 종목 시세 조회
struct CoinModel: Decodable{
    let market: String
    let timestamp: Double
    let price: Double

    enum CodingKeys: String, CodingKey{
        case market
        case timestamp
        case price = "trade_price"
    }
}
Chart Configuration
- Chart 생성
 private lazy var chartView: LineChartView = {
       let chartView = LineChartView()
        chartView.delegate = self
        return chartView
 }()
- Chart 구성
 private func setupChart(){
        // 차트에 데이터가 없을 경우
        self.chartView.noDataText = "출력 데이터가 없습니다."
        self.chartView.noDataFont = .systemFont(ofSize: 20)
        self.chartView.noDataTextColor = .lightGray
        // Chart Configuration
        self.chartView.backgroundColor = .white // 차트 기본 뒷 배경색
        self.chartView.legend.enabled = false   // x축 세로선 제거
        self.markerView.chartView = self.chartView // marker에 chart 등록
        self.chartView.marker = markerView // chart에 marker등록
        // 왼쪽 축 제거
        self.chartView.leftAxis.enabled = false
        // 오른쪽 축 제거
        self.chartView.rightAxis.enabled = false
        // x축
        self.chartView.xAxis.enabled = true
        self.chartView.xAxis.labelFont = .systemFont(ofSize: 11, weight: .light)
        // x축 처음, 마지막 label text 잘리지 않게 수정
        self.chartView.xAxis.avoidFirstLastClippingEnabled = true
        // x축 Label
        self.chartView.xAxis.labelPosition = .bottom // Label 위치
        self.chartView.xAxis.setLabelCount(6, force: true) // Label 개수
        self.chartView.xAxis.valueFormatter = CustomAxisFormatter() // Label Formatter
        // 생성한 함수 사용해서 데이터 적용
        self.setLineData(lineChartView: self.chartView,
                         lineChartDataEntries: self.entryData(x: self.coinTimesArray, y: self.coinPricesArray))
    }
- 가져온 데이터를 Chart에서 사용하기 위해 ChartDataEntry를 만들고 Entry로 DataSet 구성
- ChartDataSet에서 보이게 되는 Chart의 속성을 설정
// entry 만들기
func entryData(x: [Double], y: [Double]) -> [ChartDataEntry] {
    // entry 담을 array
    var lineDataEntries: [ChartDataEntry] = []
    // 담기
    for i in 0 ..< x.count {
        let lineDataEntry = ChartDataEntry(x: x[i], y: y[i])
        lineDataEntries.append(lineDataEntry)
    }
    // 반환
    return lineDataEntries
}
// 데이터 적용하기
func setLineData(lineChartView: LineChartView, lineChartDataEntries: [ChartDataEntry]) {
    // Entry들을 이용해 Data Set 만들기
    let lineChartdataSet = LineChartDataSet(entries: lineChartDataEntries)
    lineChartdataSet.drawCirclesEnabled = false // 점 제거
    lineChartdataSet.highlightEnabled = true
    lineChartdataSet.highlightLineWidth = 1.0
    lineChartdataSet.highlightColor = .orange
    lineChartdataSet.lineWidth = 1.5
    lineChartdataSet.colors = [.systemBlue] // 라인 색상 설정
    // DataSet을 차트 데이터로 넣기
    let lineChartData = LineChartData(dataSet: lineChartdataSet)
    // 데이터 출력
    lineChartView.data = lineChartData
}
AxisValueFormatter
- 각 축에서 보여지는 Label(구분선)을 설정해 줄 수 있음
// setupChart에서 원하는 축의 valueFormatter를 설정
self.chartView.xAxis.valueFormatter = CustomAxisFormatter() // Label Formatter

// AxisValueFormatter 채택하여 Axis Label 설정
class CustomAxisFormatter: AxisValueFormatter {
    func stringForValue(_ value: Double, axis: AxisBase?) -> String {
        let date = Date(timeIntervalSince1970: value)
        let dateFormatter = DateFormatter()
        dateFormatter.dateFormat = "M/d"

        return dateFormatter.string(from: date)
    }
}
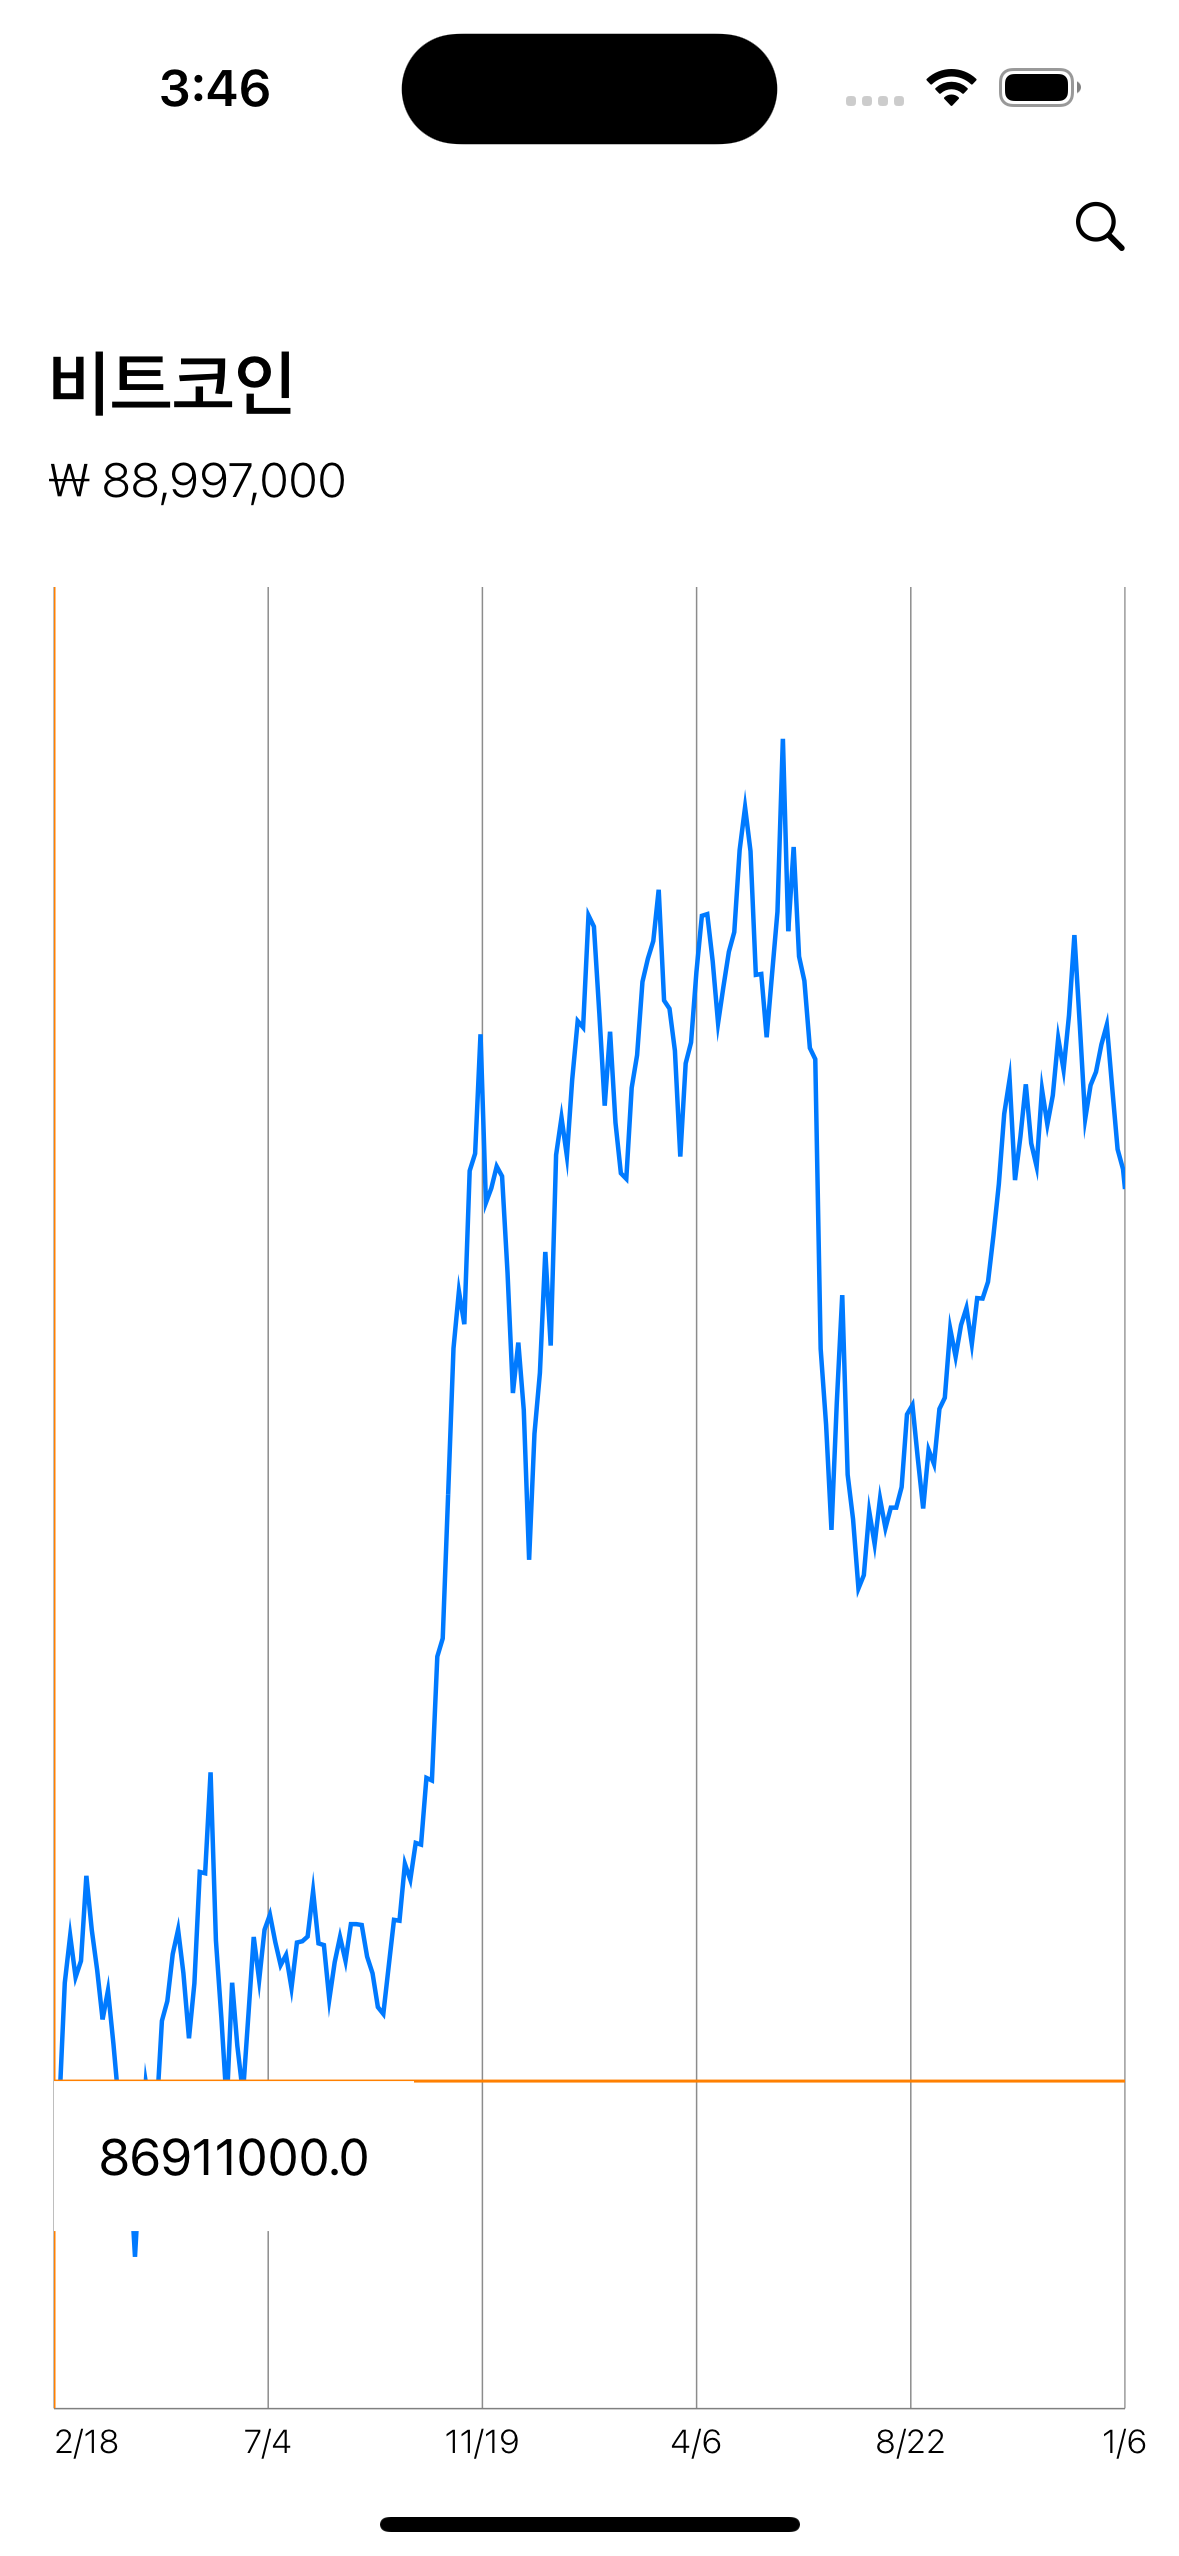
MarkerView
- 그래프를 터치했을 때 MarkerView를 보이게 설정
- CustomMarkerView 구현(코드)
class CustomMarkerView: MarkerView{

    @IBOutlet weak var contentView: UIView!
    @IBOutlet weak var priceLabel: UILabel!


    override init(frame: CGRect) {
        super.init(frame: frame)
        initUI()
    }
    required init?(coder: NSCoder) {
        super.init(coder: coder)
        initUI()
    }
    private func initUI() {
        Bundle.main.loadNibNamed("CustomMarkerView", owner: self, options: nil)
        self.addSubview(contentView)
    }
}
- CustomMarkerView 구현(Storyboard)
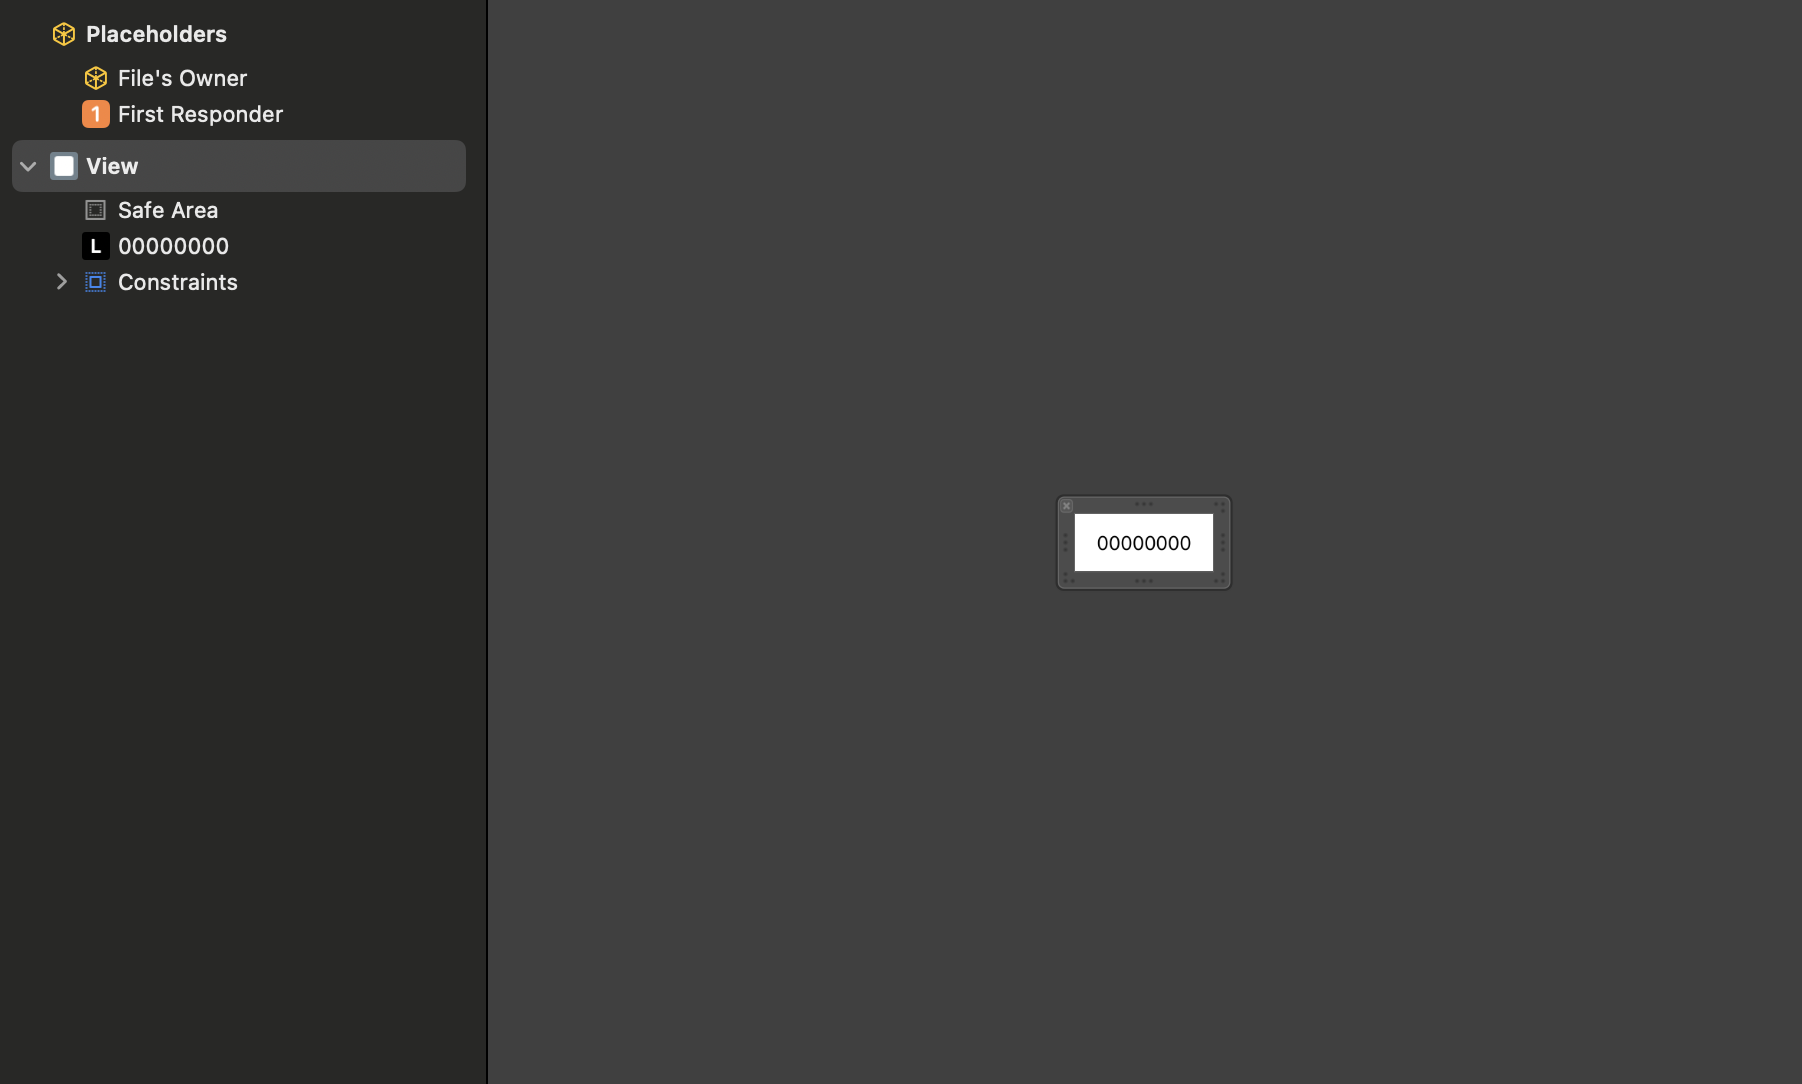
- Chart에 CustomMarkerView 추가
self.markerView.chartView = self.chartView // marker에 chart 등록
self.chartView.marker = markerView // chart에 marker등록

extension MainViewController: ChartViewDelegate{
// 차트 선택 시 marker에 선택한 value값 추가
    func chartValueSelected(_ chartView: ChartViewBase, entry: ChartDataEntry, highlight: Highlight) {
        self.markerView.priceLabel.text = "\(entry.y)"
    }
}
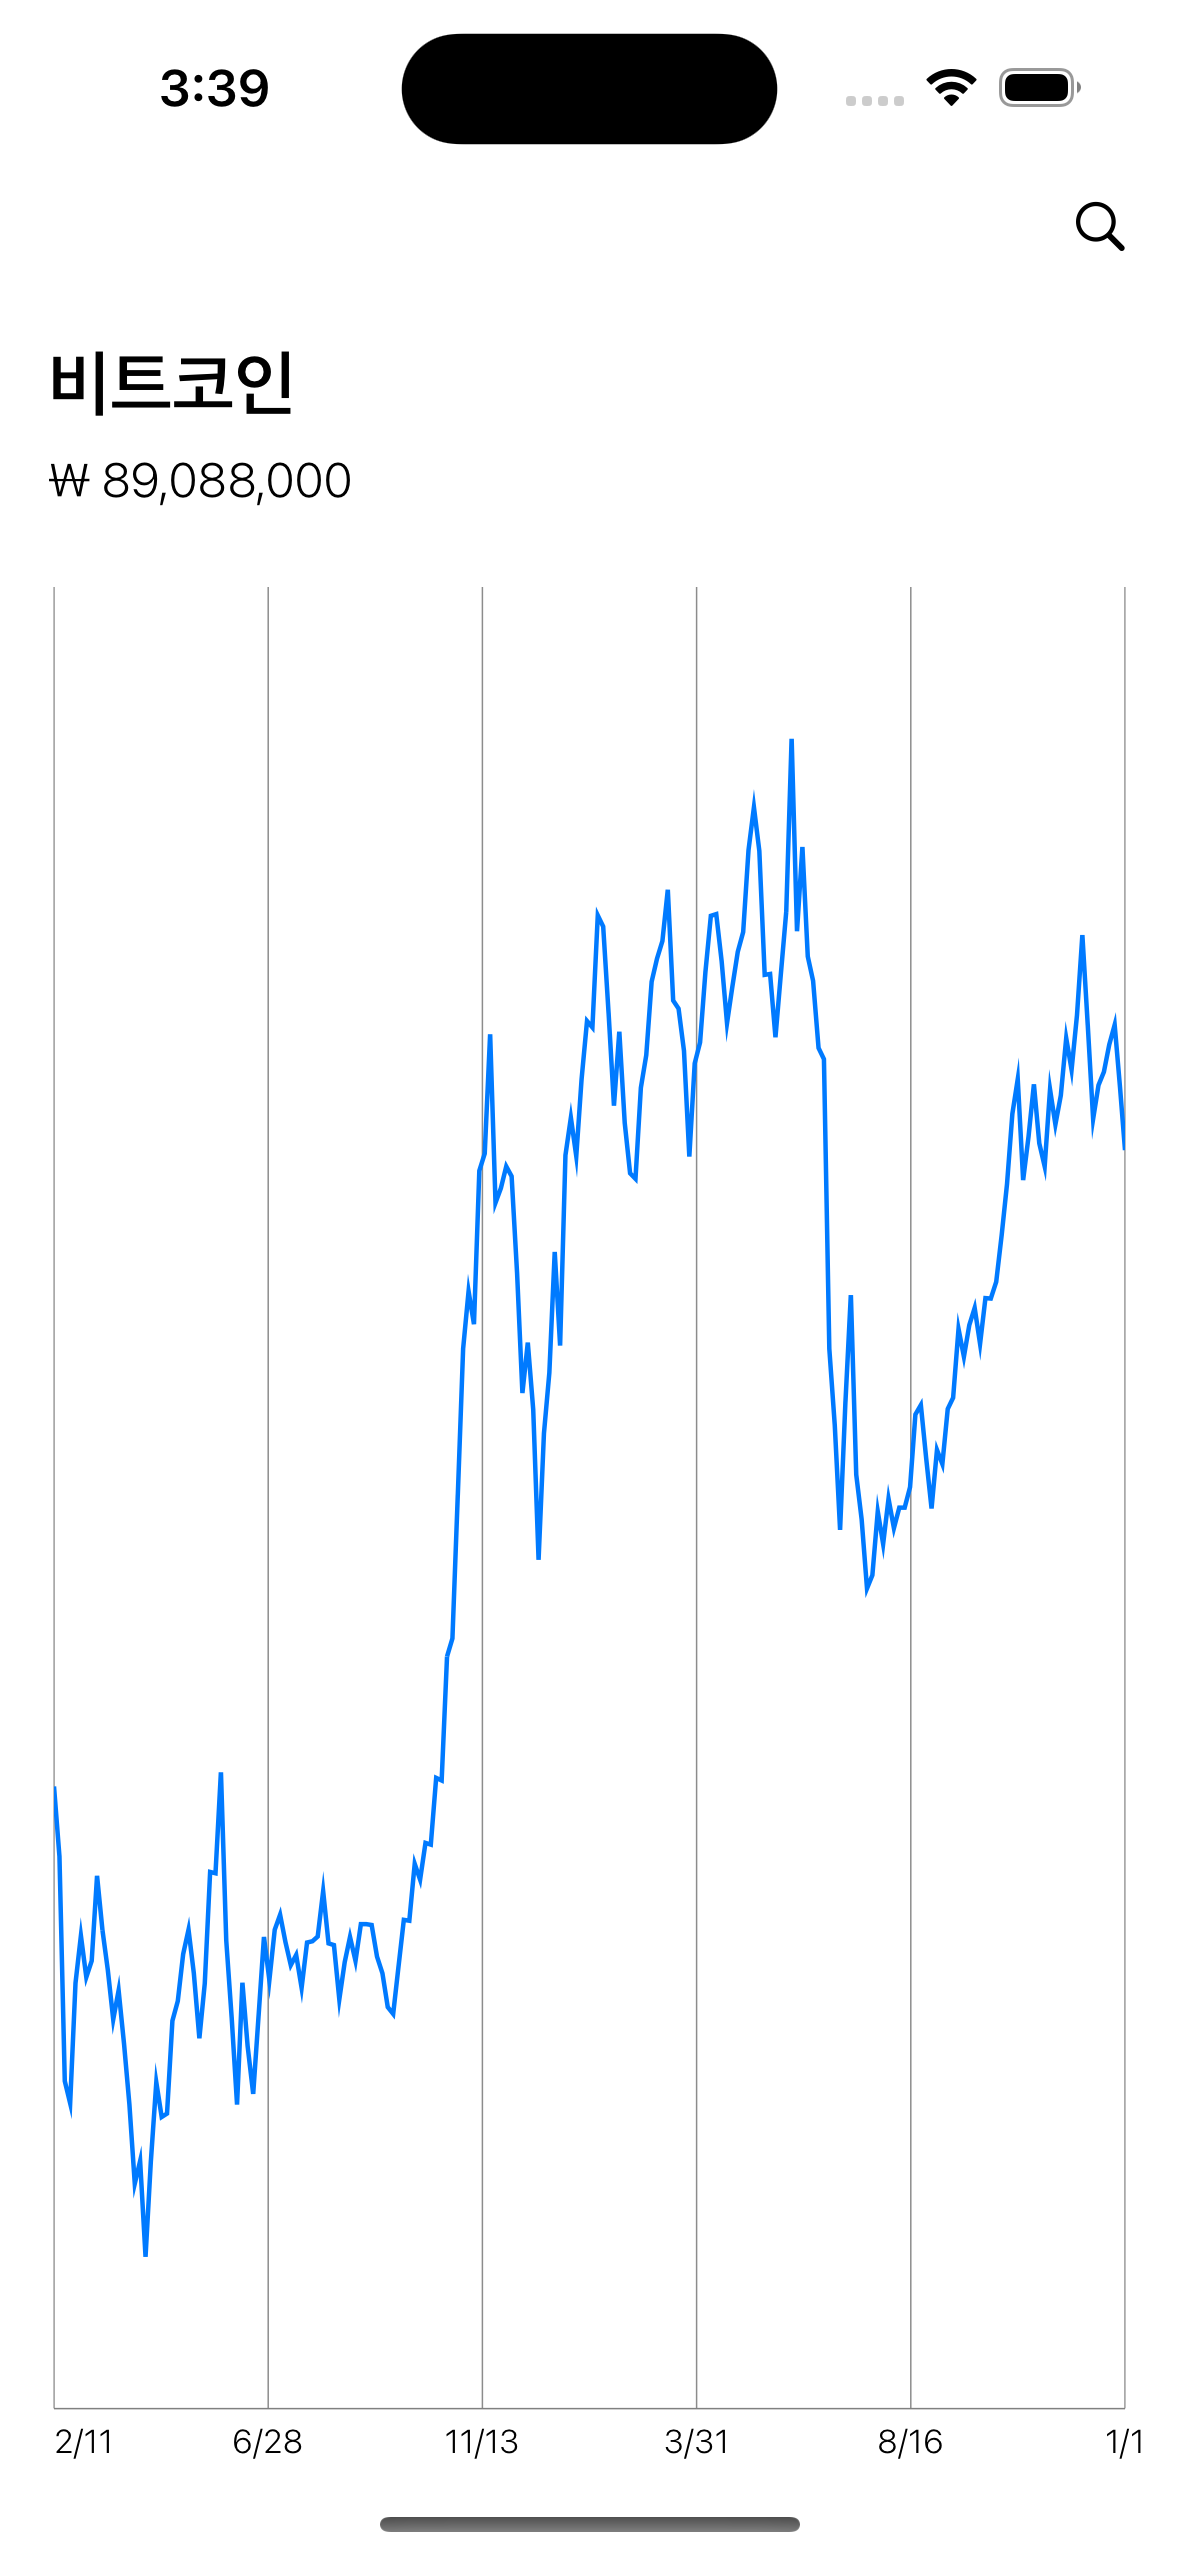
Result
https://github.com/kimkhuna/CoinChartView
GitHub - kimkhuna/CoinChartView
Contribute to kimkhuna/CoinChartView development by creating an account on GitHub.
github.com
참고
Open API | 업비트 개발자 센터
docs.upbit.com
[iOS/Swift] DGCharts 그래프 라이브러리 Line Chart 표시하기, 라인 차트 그리기
[iOS/Swift] Charts 그래프 라이브러리 Line Chart 표시하기, 라인 차트 그리기 안녕하세요. 오늘은 Line 차트를 그려볼 예정입니다. 지난 Bar 차트 그리기에서 UI 배치하는 방법은 다 했기 때문에 이번 시
jiwift.tistory.com
[iOS/Swift] DGCharts 그래프 라이브러리 커스텀 마커 | Highlight Selected Value With a Custom Marker | 선택 값 출
[iOS/Swift] Charts 그래프 라이브러리 커스텀 마커 | Highlight Selected Value With a Custom Marker | 선택 값 출력 꾸미기 오늘은 Custom Marker를 만들어보도록 하겠습니다. 선택하면 나오는 Value를 좀 더 Custom 해서
jiwift.tistory.com
[iOS] - Chart 라이브러리 적용 및 이슈 해결하기 (1)
DGchart(aka 'Charts') 라이브러리를 사용하여 Line chart View를 구현하고 이슈를 해결한 과정을 작성합니다. 📍 Line chart 를 구현하는 과정을 다루고 있습니다
velog.io
[iOS] - Chart 라이브러리 적용 및 이슈 해결하기 (2)
DGchart(aka 'Charts') 라이브러리를 사용하여 Line chart View를 구현하는 방법과 이슈 해결 과정을 작성합니다. 📍 Line chart 를 개발하며 발생한 이슈 해결 과정을 다루고 있습니다. 목차 Line chart View구현
velog.io
Not to start xAxis at zero in LineChart iOS Swift
I have created lineChartView. Below xAxis values are displayed hours with 1 hour time interval. My graph starts at 0 and I am not able to show proper xAxis label value. I want to put extra space in...
stackoverflow.com
'iOS > Library' 카테고리의 다른 글
| [iOS] PinLayout (0) | 2024.05.25 |
|---|---|
| [iOS] SwiftLint (1) | 2024.01.14 |
| [iOS] Cocoa Pod 사용법 (0) | 2022.07.11 |